|
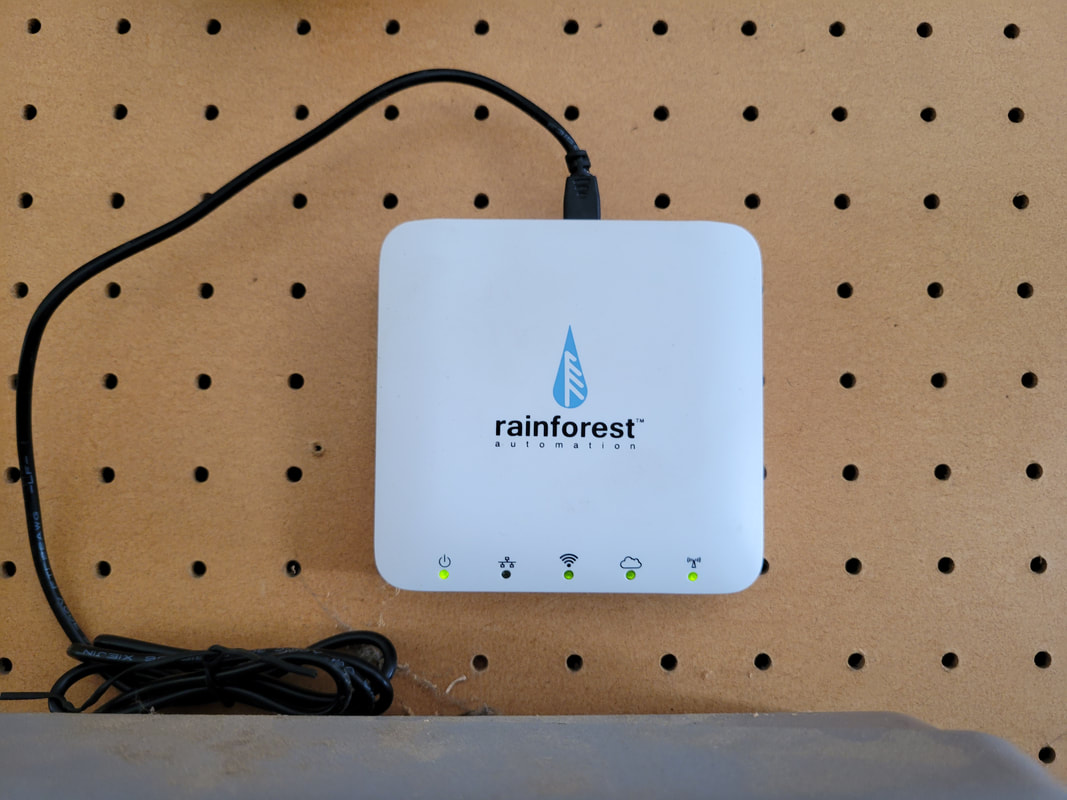
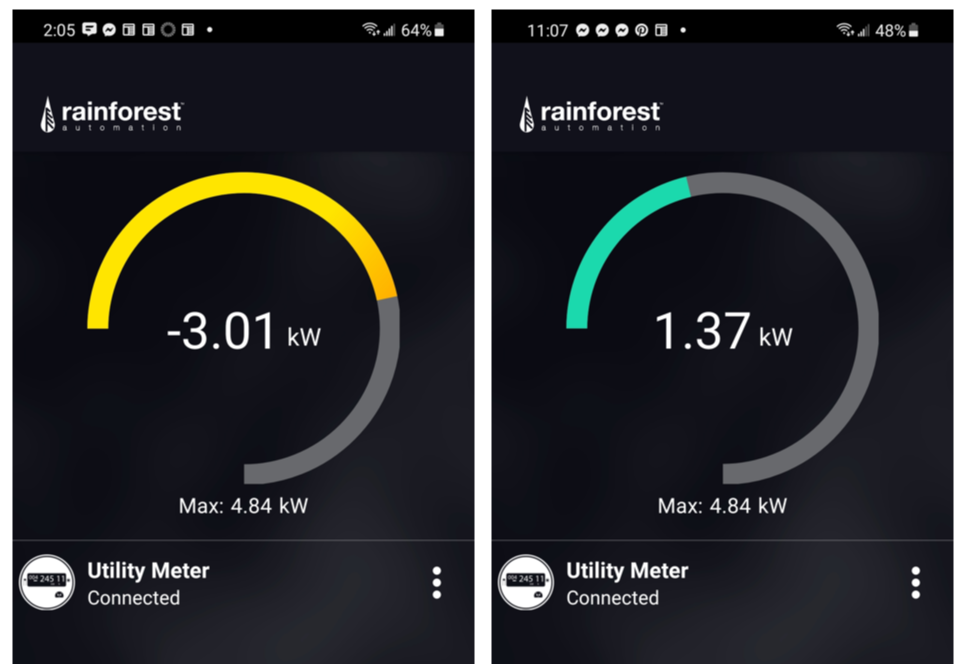
My wife recently read Ashlee Vance's book about Elon Musk. She found it compelling - and reported I would as well. She was right. I loved it. As a result of learning more about Musk, his vision, and his drive we decided to order a Tesla. Delivery is a ways out (Mar 2022). But that hasn't stopped us from thinking about what driving will be like with an electric vehicle, and figuring out ways to use it as efficiently as possible. Since we already have solar panels on our house, we started thinking about whether we'd need additional solar production, as well as strategies for optimizing charging the car. It would be great if we could automatically adjust car charging based on electricity being produced by our solar array and electric consumption in the house ... all in real time. We want to see how much power we really need to meet our needs. Monitoring Solar Output A number of months ago we decided we wanted a better real-time handle on whether we were sending power back to the grid or pulling power from the grid. We bought an Eagle-200 from Rainforest Automation. This little box (~$100) connects (via Zigbee) to your smart electric meter. There is a nice phone app that provides a view of what is happening at the meter. This enables us to see if power is being sent to the grid (solar production exceeding current household use) or the opposite - we're pulling power from the grid.
Controlling Car Charging The Tesla's phone app enables the user to start and stop car charging, charging based on time of day, and also charging speed. Putting Them Together The easiest solution to synchronize the two is to look at the Eagle-200's app and see if excess power is going to the grid, and then use the Tesla's app to start or stop charging as appropriate. While this method clearly provides benefit, it's not ideal. Weather changes through the day impact solar production. Usage in the home also varies. This results in sometimes significant variations in how much energy is being returned or pulled from the grid at any given moment. An automated solution would be much more effective. Fortunately both the Eagle-200 and the Tesla have APIs that can be used to programmatically communicate with each device. Since I have the Eagle-200 I was able to work out getting instantaneous power data from it into a Python program. I wrote a simple program to start/stop car charging, as well as adjust rate of charge based on power flow at the meter. Obviously I need to actually have the car before the solution is truly implemented. But placeholders have been created where car-specific code will be placed when we take delivery of the car and the connections can be tested. (I'm also confident the code, as written below, won't behave as expected when it really gets connected to the car. I always surprise myself with unexpected realities when testing software.) 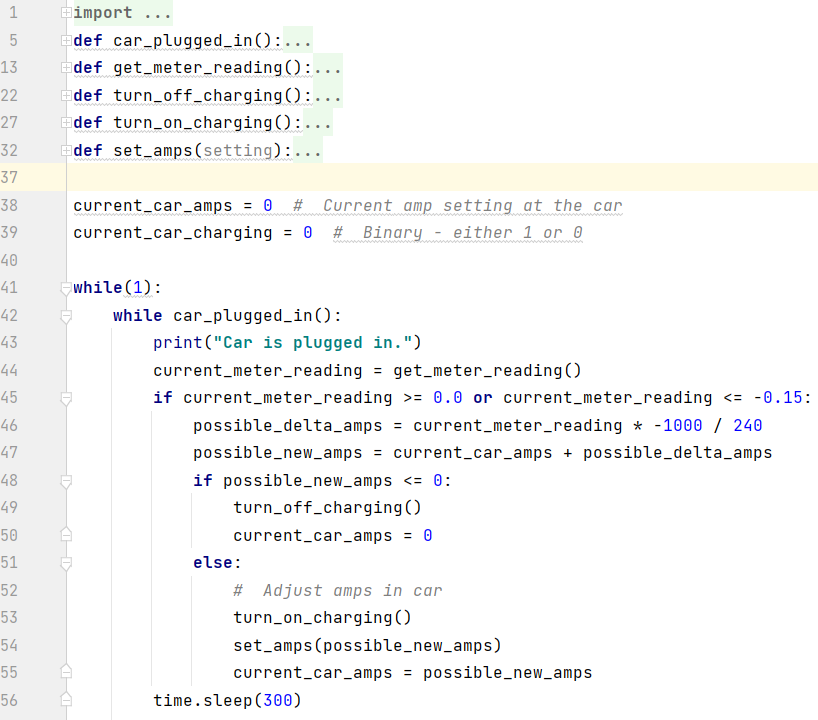 Hopefully a simple solution like this will enable us to maximize the utilization of power being generated by the solar array. Thanks to Lalit Pandit for help with JSON and Python!  
0 Comments
NoCo Train Alert needs your brain cells and creativity. The north camera has been doing a reasonable job detecting trains during the day. Train detection at night has been problematic. ("Night time" meaning "after dark.") We're seeking ideas for identifying patterns in data, generated by image analysis, between non-train suspects and real trains - with the goal of improving overall train detection accuracy. The specific request will be laid out after some basics of how things work are established. How Train Detection Works The train detection portion of Train Alert is a python program that uses OpenCV - an open source library of image analysis software. The north camera (a Raspberry Pi with integrated camera) reads 2-3 images per second. After an image is read OpenCV identifies what, if anything, is "new" in the image (something is deemed "new" if it wasn't seen in the previous 3-5 images). The size and location of the new item is specified via coordinates of a rectangle drawn around the object. OpenCV uses 4 integers to define a rectangle. 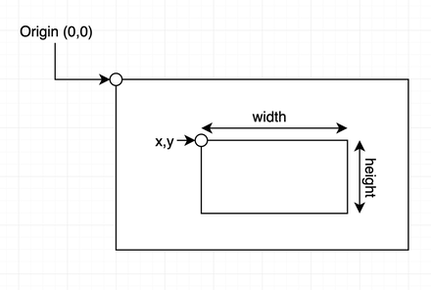 x = # of pixels top left corner of rectangle is from the image's left edge y = # of pixels top left corner of rectangle is from the image's top edge w = width of rectangle; measured in pixels h = height of rectangle; measured in pixels When something new and interesting (i.e. relatively large in size) is reported in a frame Train Alert reads two additional frames and records the resulting 8 values (4 for each frame). At this point three frames have been processed, and 3 sets of x, y, w and h values have been collected. Now it is time to decide whether these 12 collected values are indicative of a train or not. The frequency a new and interesting object (i.e. train suspect) appears in the frame is quite high - oftentimes numerous times per minute. Obviously trains don't appear that frequently. Leaves blowing in the wind, changes in light due to clouds, a car driving in the frame - these and other situations are examples of what can be reported as "new" in the frame. The challenge is to separate the non-train chaff from what is really of interest: a train. Here is one very clear example of a how a train presents itself during a daytime detection scenario. The train is traveling left-to-right (northbound) in this data set: 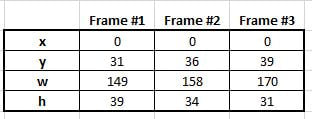 Key things to notice in the data:
Daytime trains traveling in the opposite direction present similarly clear data:
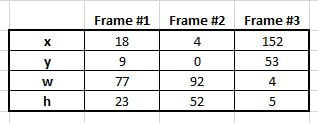 Note how all values (in this example) show high variance. Not all non-train scenarios, however, are as easy to weed out as the above scenario. Some non-train scenarios are more subtle. Through data gathering and trial-and-error we've determined if all of the following conditions are true we can virtually guarantee a train is in the frame:
Nighttime Train Detection Daylight, literally, enables clear vision and, consequently, data that is clear and straightforward to interpret. At night circumstances change substantially. Overall the software has more difficulty seeing changes in scenes primarily due to reduced lighting. Some other aspects of the camera installation make nighttime train detection challenging:
The Problem Nighttime trains traveling left-to-right have been particularly difficult to identify. As stated previously, the train is moving away from the camera so it is not possible to see the train's headlamps, which results in the camera not having a clear indication of change/movement in the frame. As a result, data representing trains in this scenario do not look like train data generated for other scenarios. We are seeking help in identifying patterns/tests that can be used to identify nighttime left-to-right (northbound) trains. When looking at non-train and train data, what are those unique characteristics or combination of characteristics that enable a train to be identified while ignoring non-train anomalies? This is some of the data we've collected for both train and non-train scenarios. 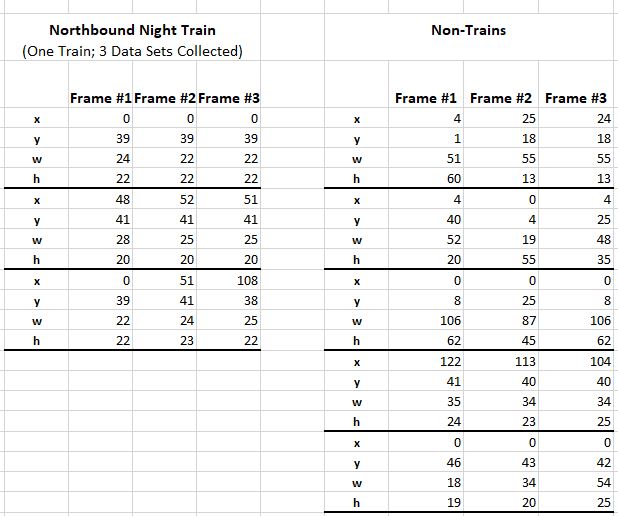 One metric used in other scenarios (such as daytime detection) is Extreme Spread (ES). An example of the kind of observation being sought: It appears a left-to-right train is present when all 4 measurements have a very low ES. This method, however, proved inadequate when the last Non-Train data set was collected. We're asking people to look at and play with this data to see if you can identify tests we can do in the software to reliably distinguish between train and non-train data.
The above data can be accessed either by downloading this Excel file or by accessing this public Google Sheet. (Please copy the data to another Google Sheet prior to manipulating the data so others can get clean copies of the data.) FYI: We've generally found best detection accuracy occurs when multiple train-positive events occur in a data set- such as growing rectangle width AND changing x measurement, for example; although clearly that particular test will not positively identify a train in the above data. The key is to find those unique ways of looking at the data and its patterns to filter out the noise but recognize a train. THANK YOU for helping with this! If you have observations or suggestions please either leave a comment below or send email to [email protected]. Jim It has been a while……a long while……since I’ve done an update on TrainAlert. This is not due to lack of activity. In fact, my lack of updating here is because of the effort that has been going into TrainAlert. (For the unitiated: TrainAlert is a solution, currently under development, to identify when a train is approaching the town where I live so subscribers can “get on the right side of the tracks” before the inevitable traffic disruption occurs.) The primary challenges in getting this solution built have been 1/ finding a robust technology set upon which to base the solution and 2/ unlearning my 30 year old programming knowledge and applying modern software techniques. The first challenge was addressed thanks to a friend who is interested in Computer Vision technologies. He pointed me to OpenCV, an open source library of image analysis software routines. The second challenge was addressed with time, Google and helpful people on the internet. This blog post is not about the upcoming release of the solution per se. Instead it’s about the stunning capabilities available in OpenCV. OpenCV is yet another fantastic example of what the open source model can deliver. So if you’re interested in kind-of-geeky Computer Vision topics……read on. OpenCV can perform a broad set of tasks on digital images. The images can be still pictures (i.e. photos) or frames from a video camera. The train detection portion of TrainAlert is built using OpenCV routines, tied together by custom code written in Python to handle a variety of logic and analytic tasks. There are three primary OpenCV capabilities that are used to detect passing trains. Background Subtraction The first step in identifying a passing train is finding items that might be a train. Background Subtraction is the OpenCV process/method of identifying new objects in an image…..objects that aren’t normally there. OpenCV’s background subtraction capability watches video frames over time (it keeps a history of the previous 5 video frames) and then identifies items in the current frame that are new. It can’t identify what those items are. They could be a variety of things. But it can at least identify that something new is now in the frame. When something new is found in a frame OpenCV then “subtracts out” the background portions of the image. What is left is an image that contains only foreground objects (i.e. those items that are new). Contour Identification Once it is known new objects are in the frame, they must be identified and characterized in some way. OpenCV can provide size and location information about objects in images. OpenCV calls these descriptors “contours”. For example, OpenCV can draw a rectangle around each contour found in an image, and give back the details of those rectangles; most notably the coordinates of the rectangle’s four corners. (OpenCV will return a list of rectangle coordinates for every contour in an image.) In the case of finding a train, a way to prioritize which contour might be most interesting is by its size. Obviously, trains are pretty large objects. So after knowing there are new objects in the frame, along with the sizes and locations of the foreground items, the TrainAlert program picks the largest frame contour and considers this the most likely "train suspect". However the found contour is still just a suspect. This new “large object” could be grass blowing in the wind. Or vehicles that are visible in the distance. Or clouds that are making dramatic movements. Additional analysis needs to be done to determine if there really is a train in the frame or whether this large contour is some non-train anomaly. Object Tracking One way to discern a train vs non-train contour is to see if and how it moves. A train traveling down a track moves in a pretty predictable fashion. The “big object” needs to be tracked to see if it is moving and, if so, by how much. This is where OpenCV's Object Tracking capability is useful. In order to track an object the TrainAlert program gives the OpenCV Object Tracker the coordinates of the large object that needs to be tracked. OpenCV looks at the color profile found in that contour, and then looks for that same color profile in subsequent video frames coming off the camera. When OpenCV sees that object, it delivers back to TrainAlert the coordinates for where that object is in that most-recently read video frame. When this process is completed for a sampling of video frames, a location history will have been collected for where in the frame that object is over multiple video frames. At this point OpenCV has done all that it can do. Now it's time for TrainAlert to decide "Is this a train or isn't it a train?" In a simple and ideal world one looks at total distance traveled in the frame, compares the starting and ending positions, and concludes the train's direction of travel. Unfortunately, the world is neither simple nor ideal. It's not very easy to decide if there actually is a train or not. The train is not always identified in the same portion of the frame. And some non-train objects don't move like a train moves. Wind blowing tree branches might result in movement data, but the data will likely be lots of "back-and-forth" and will not have consistent progression in the same direction over time. Car lights in the distance definitely move in a consistent direction, but their movement is not as dramatic as train movement because they are farther away in the frame. There are other non-train scenarios as well. Here are two examples of object tracking. The first shows how OpenCV tracked a real train. The second video shows how OpenCV found "something new" in the frame, tracked it, but it turned to not be a train.
The trick in building this solution has been figuring out an algorithm that will look at the collected horizontal position values and decide whether the object in question is behaving as a train would. Unfortunately it's not quite as simple as seeing if every data point shows progression in the same direction. The precision of Object Tracking is not perfect. Even with actual trains Object Tracking will sometimes report either no movement or "backward" movement for one or two frames. The tracked "bush" in the second video is easy to disregard, as total horizontal movement is in a very narrow window. But other items that aren't trains don't behave in this way. I’ll spare the reader the gory details, but the bottom line is a variety of train and non-train object tracking data was put into a spreadsheet and patterns were identified. Those patterns were identifiable with some simple calculations and, as a result, a method for determining train vs non-train scenarios has been developed. Although these methods, too, are not perfect, current testing is showing an accuracy rate of greater than 90% for correctly identifying passing trains. The train detection portion of TrainAlert is in final testing mode. Without the OpenCV technology (and the help of others) I don’t believe this portion of the solution would be in the state it is today. OpenCV is an astonishing technology that makes me very enthused about the types of solutions that are possible in the future. It will be exciting to see what sort of Computer Vision applications become available. So what is next for TrainAlert? This article has been only about the train detection portion. But there also needs to be a “subscriber notification” portion of TrainAlert – the infrastructure to deliver alerts to users. Another generous friend is helping me on that front. As that gets solidified more will be written here to describe how that works. For now we’re marching ahead to finalize the first release – and help the citizens of Northern CO deal with the disruptive train traffic that plagues the area. Jim    |
Jim's BlogThoughts about Solar Energy, Electric Cars, Train Alert and more. Archives
February 2022
Categories
All
|
 RSS Feed