|
NoCo Train Alert needs your brain cells and creativity. The north camera has been doing a reasonable job detecting trains during the day. Train detection at night has been problematic. ("Night time" meaning "after dark.") We're seeking ideas for identifying patterns in data, generated by image analysis, between non-train suspects and real trains - with the goal of improving overall train detection accuracy. The specific request will be laid out after some basics of how things work are established. How Train Detection Works The train detection portion of Train Alert is a python program that uses OpenCV - an open source library of image analysis software. The north camera (a Raspberry Pi with integrated camera) reads 2-3 images per second. After an image is read OpenCV identifies what, if anything, is "new" in the image (something is deemed "new" if it wasn't seen in the previous 3-5 images). The size and location of the new item is specified via coordinates of a rectangle drawn around the object. OpenCV uses 4 integers to define a rectangle. 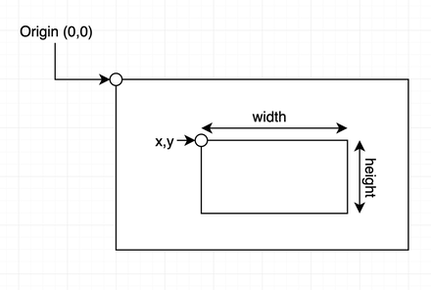 x = # of pixels top left corner of rectangle is from the image's left edge y = # of pixels top left corner of rectangle is from the image's top edge w = width of rectangle; measured in pixels h = height of rectangle; measured in pixels When something new and interesting (i.e. relatively large in size) is reported in a frame Train Alert reads two additional frames and records the resulting 8 values (4 for each frame). At this point three frames have been processed, and 3 sets of x, y, w and h values have been collected. Now it is time to decide whether these 12 collected values are indicative of a train or not. The frequency a new and interesting object (i.e. train suspect) appears in the frame is quite high - oftentimes numerous times per minute. Obviously trains don't appear that frequently. Leaves blowing in the wind, changes in light due to clouds, a car driving in the frame - these and other situations are examples of what can be reported as "new" in the frame. The challenge is to separate the non-train chaff from what is really of interest: a train. Here is one very clear example of a how a train presents itself during a daytime detection scenario. The train is traveling left-to-right (northbound) in this data set: 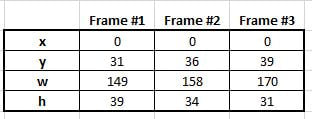 Key things to notice in the data:
Daytime trains traveling in the opposite direction present similarly clear data:
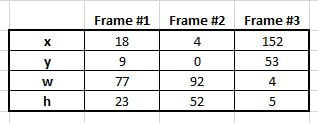 Note how all values (in this example) show high variance. Not all non-train scenarios, however, are as easy to weed out as the above scenario. Some non-train scenarios are more subtle. Through data gathering and trial-and-error we've determined if all of the following conditions are true we can virtually guarantee a train is in the frame:
Nighttime Train Detection Daylight, literally, enables clear vision and, consequently, data that is clear and straightforward to interpret. At night circumstances change substantially. Overall the software has more difficulty seeing changes in scenes primarily due to reduced lighting. Some other aspects of the camera installation make nighttime train detection challenging:
The Problem Nighttime trains traveling left-to-right have been particularly difficult to identify. As stated previously, the train is moving away from the camera so it is not possible to see the train's headlamps, which results in the camera not having a clear indication of change/movement in the frame. As a result, data representing trains in this scenario do not look like train data generated for other scenarios. We are seeking help in identifying patterns/tests that can be used to identify nighttime left-to-right (northbound) trains. When looking at non-train and train data, what are those unique characteristics or combination of characteristics that enable a train to be identified while ignoring non-train anomalies? This is some of the data we've collected for both train and non-train scenarios. 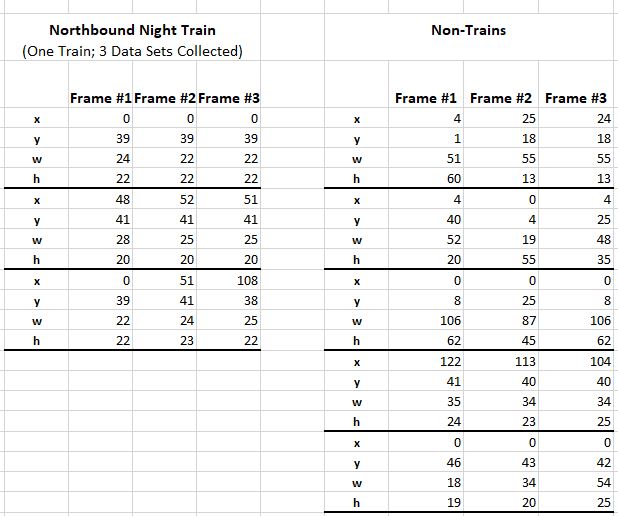 One metric used in other scenarios (such as daytime detection) is Extreme Spread (ES). An example of the kind of observation being sought: It appears a left-to-right train is present when all 4 measurements have a very low ES. This method, however, proved inadequate when the last Non-Train data set was collected. We're asking people to look at and play with this data to see if you can identify tests we can do in the software to reliably distinguish between train and non-train data.
The above data can be accessed either by downloading this Excel file or by accessing this public Google Sheet. (Please copy the data to another Google Sheet prior to manipulating the data so others can get clean copies of the data.) FYI: We've generally found best detection accuracy occurs when multiple train-positive events occur in a data set- such as growing rectangle width AND changing x measurement, for example; although clearly that particular test will not positively identify a train in the above data. The key is to find those unique ways of looking at the data and its patterns to filter out the noise but recognize a train. THANK YOU for helping with this! If you have observations or suggestions please either leave a comment below or send email to [email protected]. Jim
0 Comments
|
Jim's BlogThoughts about Solar Energy, Electric Cars, Train Alert and more. Archives
February 2022
Categories
All
|
 RSS Feed