|
In the world of gas cars we have a well-accepted metric for understanding a car's efficiency: Miles per Gallon (MPG). MPG is often used to get a general sense for how "expensive" a car will be to operate. (e.g. "35 MPG is pretty good......5 MPG is pretty bad.") It also is used to compare the efficiency of two cars. However in the world of electric cars this metric obviously doesn't make sense, as there are no "gallons of gas" in an electric car.
The Electric Vehicle industry has developed a metric they hope will be an equivalent to MPG: Miles Per Gallon Equivalent (MPGe). The thought process goes like this: One gallon of gasoline contains the same energy as 33.7 kWh of electricity. Therefore, if an electric car can travel 100 miles on 33.7 kWh of electricity, it would have an efficiency of 100 MPGe. This methodology can be used to compare the relative efficiency of two electric cars. But it doesn't help gasoline car owners get a sense of the operating costs of an electric car. Our electric car has an MPGe of 117 city and 131 highway. I don't know about you - but that data doesn't help me understand whether operating this car will be "expensive" or "cheap". We took delivery of our electric car on Dec 8, 2021. Through Jan 31, 2022 we've driven 635 "local" miles (i.e. errands and other trips close to home). We also drove 2,911 miles over 9 days during a trip to CA and back. The following cost comparison excludes that road trip - since that was not "typical" driving for us. Gasoline Vehicle Cost Our electric car replaced a 2019 GMC Terrain. The Terrain typically got about 25 MPG in city driving. 635 miles would require a little over 25 gallons of fuel. At $3.34/gal - that's a fuel cost of $83.50. Electric Vehicle Cost We charge our car using electricity from two sources. Our preferred power source for car charging is our solar panels. If we're not able to get the power we need from solar we pay for power from our electric company - like we do when we use any other electric appliance in our house. Driving the 635 of in-town miles required 301 kWh of electricity. 251 kWh came from the solar panels. 50 kWh were purchased from the electric utility. The 251 kWh from solar that went into the car weren't "free". If we had returned that power to the utility (sold it to them) we would have received $15.06 of credit toward our electric bill. The 50 kWh we purchased cost us $3.50. Therefore, the energy needed to drive those 635 of in-town miles cost us $18.56. This, of course, does not include other costs of gas cars such as oil changes, etc. Including those would make the difference even more dramatic. $83.50 for gasoline vs $18.56 for electricity - to drive 635 miles. On a per-mile basis the electric car costs us about 22% of the cost of a gasoline vehicle. Not everyone has solar panels. So what would the energy for the 635 miles cost if all of it had been purchased from our utility? $24.57. Still - considerably less expensive than gasoline-based transportation. Jim
0 Comments
Sometimes technology utterly stuns me. The first time I downloaded an album from the comfort of my couch is one instance. Receiving a phone call in the car for the first time is another. The most recent example: A car having an API and what can be done as a result.
The first few hours of learning to use the Tesla API were pretty frustrating. My "Hello World" program was a few lines of code to honk the horn. After an hour or two I got it to work: Wife: "What was that?" Me: "That was the sound of Python talking to the car!" A program talking to a car was the first stunning event. The second came when I used a simple "Get Status" command and saw what was returned. Listing all of the information here would make this post too long. But examples of available car data include: GPS coordinates, battery charge level, odometer reading, cabin temperature, status of each of the 5 seat heaters, is someone sitting in the driver seat....and on...and on...and on. The final stunning event: The Tesla is connected to the internet all the time. So getting this data, as well as the ability to control various car functions, can be performed wherever the car is. Before learning the detailed capabilities of the API I figured, when checking if the car was home, I'd attempt a ping on the local network. But instead Suncatcher checks the car's GPS coordinates to determine if it's in the garage or not.
Amazing! Jim For those interested in learning more I'm using TeslaPy: https://github.com/tdorssers/TeslaPy A few weeks ago I wrote of a project I was starting that would adjust the charging rate of a Tesla based on the electric production coming from solar panels. The goal is to "capture" excess solar being produced (i.e. power that normally would be sold back to the utility) and direct it to the car. There are two drivers for this goal:
Since "excess power" can vary widely through the day (solar production can change based on clouds, weather, etc.; and in-house consumption varies as well with tasks such as cooking, laundry, etc.) some form of automated solution is desired to respond to these variabilities and adjust the car charging rate as needed. The First Half Of The Solution Prior to the car's arrival I put together some basic code to talk to our Eagle-200 hardware device. This little box connects wirelessly to our smart (electric) meter and reports whether electricity is flowing to the grid or being pulled from the grid. This is the key information that is required when deciding if the car charging rate should be increased or decreased. The Second Half Of The Solution Now that we've taken delivery of the car the second half of the solution has been able to be put into place: communicating with the car using Python. Initial interactions with the car's API was a fascinating experience all on its own. The amount of car information accessible via the API is simply astonishing. More on this will be written in a separate post. In order to implement this project the Tesla API is being used to:
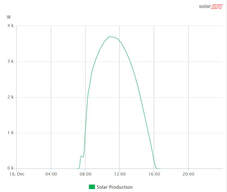
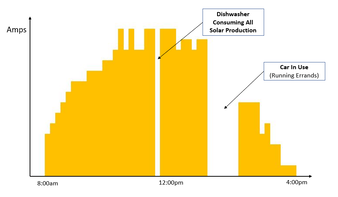
After establishing the basics of how to communicate with the car, work could begin in earnest to debug and refine the software. After about a week of work the software is now in a pretty stable state - successfully changing the rate of car charging based on leftover or "extra" power coming from the solar array. The images below show (on the left) a graph of solar production on a recent day and (on the right) a graph of car charging (amps) through the day. All adjustments to car charging (including identifying when the car was physically unavailable for charging and restarting charging on its return) were handled automatically by the software. Anyone interested in running this solution is welcome to have it - free of charge. The code needs to be "cleaned up" to make it easy for users to change some settings based on how they would prefer the software to behave (e.g. how often the system checks to see if adjustments need to be made). I will also be putting together some documentation/instructions for getting the system running.
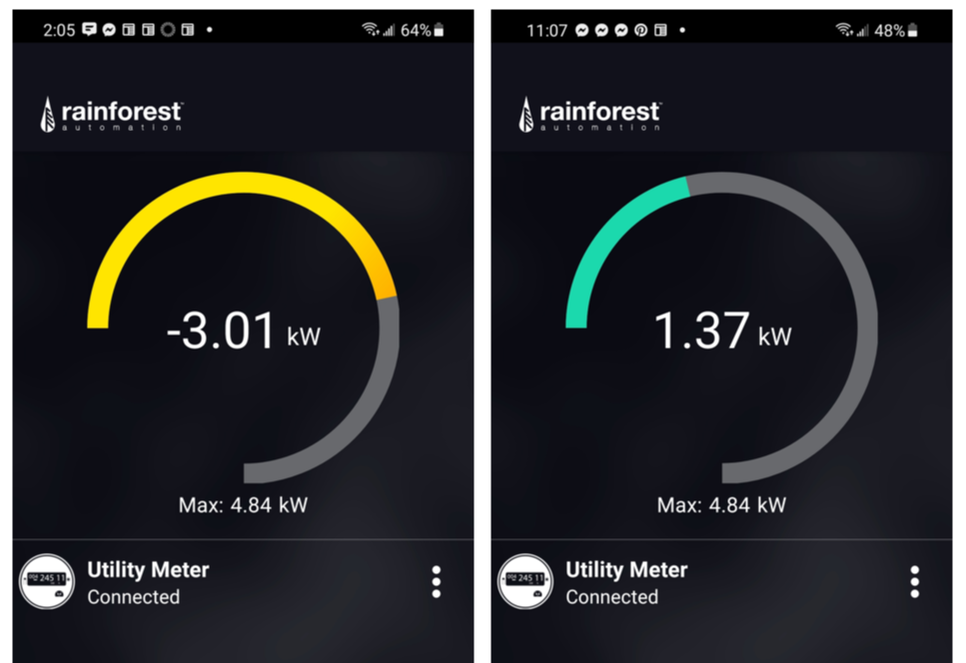
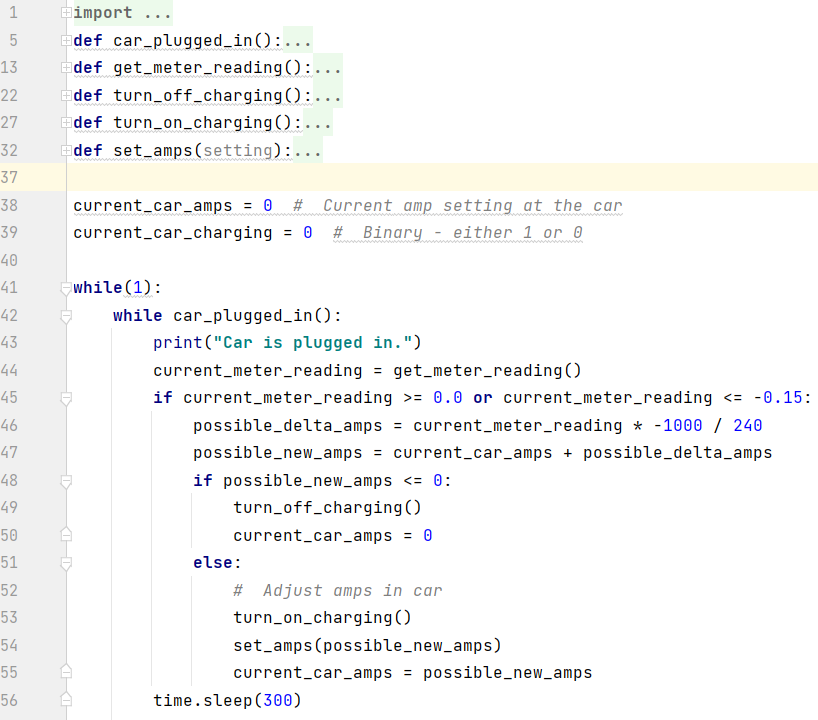
If you wish to be notified when this is ready for distribution please send me an email. I will contact you when it is ready for download. Or watch this site for new blog posts on the topic. Jim My wife recently read Ashlee Vance's book about Elon Musk. She found it compelling - and reported I would as well. She was right. I loved it. As a result of learning more about Musk, his vision, and his drive we decided to order a Tesla. Delivery is a ways out (Mar 2022). But that hasn't stopped us from thinking about what driving will be like with an electric vehicle, and figuring out ways to use it as efficiently as possible. Since we already have solar panels on our house, we started thinking about whether we'd need additional solar production, as well as strategies for optimizing charging the car. It would be great if we could automatically adjust car charging based on electricity being produced by our solar array and electric consumption in the house ... all in real time. We want to see how much power we really need to meet our needs. Monitoring Solar Output A number of months ago we decided we wanted a better real-time handle on whether we were sending power back to the grid or pulling power from the grid. We bought an Eagle-200 from Rainforest Automation. This little box (~$100) connects (via Zigbee) to your smart electric meter. There is a nice phone app that provides a view of what is happening at the meter. This enables us to see if power is being sent to the grid (solar production exceeding current household use) or the opposite - we're pulling power from the grid. Controlling Car Charging The Tesla's phone app enables the user to start and stop car charging, charging based on time of day, and also charging speed. Putting Them Together The easiest solution to synchronize the two is to look at the Eagle-200's app and see if excess power is going to the grid, and then use the Tesla's app to start or stop charging as appropriate. While this method clearly provides benefit, it's not ideal. Weather changes through the day impact solar production. Usage in the home also varies. This results in sometimes significant variations in how much energy is being returned or pulled from the grid at any given moment. An automated solution would be much more effective. Fortunately both the Eagle-200 and the Tesla have APIs that can be used to programmatically communicate with each device. Since I have the Eagle-200 I was able to work out getting instantaneous power data from it into a Python program. I wrote a simple program to start/stop car charging, as well as adjust rate of charge based on power flow at the meter. Obviously I need to actually have the car before the solution is truly implemented. But placeholders have been created where car-specific code will be placed when we take delivery of the car and the connections can be tested. (I'm also confident the code, as written below, won't behave as expected when it really gets connected to the car. I always surprise myself with unexpected realities when testing software.) Hopefully a simple solution like this will enable us to maximize the utilization of power being generated by the solar array.
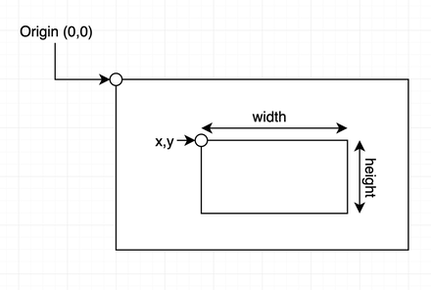
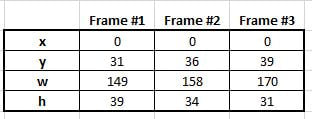
Thanks to Lalit Pandit for help with JSON and Python! NoCo Train Alert needs your brain cells and creativity. The north camera has been doing a reasonable job detecting trains during the day. Train detection at night has been problematic. ("Night time" meaning "after dark.") We're seeking ideas for identifying patterns in data, generated by image analysis, between non-train suspects and real trains - with the goal of improving overall train detection accuracy. The specific request will be laid out after some basics of how things work are established. How Train Detection Works The train detection portion of Train Alert is a python program that uses OpenCV - an open source library of image analysis software. The north camera (a Raspberry Pi with integrated camera) reads 2-3 images per second. After an image is read OpenCV identifies what, if anything, is "new" in the image (something is deemed "new" if it wasn't seen in the previous 3-5 images). The size and location of the new item is specified via coordinates of a rectangle drawn around the object. OpenCV uses 4 integers to define a rectangle. x = # of pixels top left corner of rectangle is from the image's left edge y = # of pixels top left corner of rectangle is from the image's top edge w = width of rectangle; measured in pixels h = height of rectangle; measured in pixels When something new and interesting (i.e. relatively large in size) is reported in a frame Train Alert reads two additional frames and records the resulting 8 values (4 for each frame). At this point three frames have been processed, and 3 sets of x, y, w and h values have been collected. Now it is time to decide whether these 12 collected values are indicative of a train or not. The frequency a new and interesting object (i.e. train suspect) appears in the frame is quite high - oftentimes numerous times per minute. Obviously trains don't appear that frequently. Leaves blowing in the wind, changes in light due to clouds, a car driving in the frame - these and other situations are examples of what can be reported as "new" in the frame. The challenge is to separate the non-train chaff from what is really of interest: a train. Here is one very clear example of a how a train presents itself during a daytime detection scenario. The train is traveling left-to-right (northbound) in this data set: Key things to notice in the data:
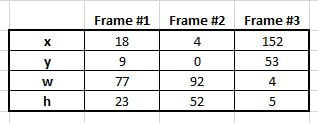
Daytime trains traveling in the opposite direction present similarly clear data:
Note how all values (in this example) show high variance. Not all non-train scenarios, however, are as easy to weed out as the above scenario. Some non-train scenarios are more subtle. Through data gathering and trial-and-error we've determined if all of the following conditions are true we can virtually guarantee a train is in the frame:
Nighttime Train Detection Daylight, literally, enables clear vision and, consequently, data that is clear and straightforward to interpret. At night circumstances change substantially. Overall the software has more difficulty seeing changes in scenes primarily due to reduced lighting. Some other aspects of the camera installation make nighttime train detection challenging:
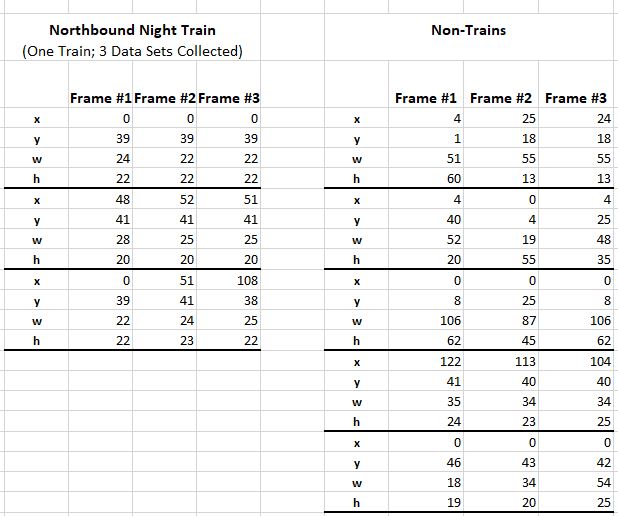
The Problem Nighttime trains traveling left-to-right have been particularly difficult to identify. As stated previously, the train is moving away from the camera so it is not possible to see the train's headlamps, which results in the camera not having a clear indication of change/movement in the frame. As a result, data representing trains in this scenario do not look like train data generated for other scenarios. We are seeking help in identifying patterns/tests that can be used to identify nighttime left-to-right (northbound) trains. When looking at non-train and train data, what are those unique characteristics or combination of characteristics that enable a train to be identified while ignoring non-train anomalies? This is some of the data we've collected for both train and non-train scenarios. One metric used in other scenarios (such as daytime detection) is Extreme Spread (ES). An example of the kind of observation being sought: It appears a left-to-right train is present when all 4 measurements have a very low ES. This method, however, proved inadequate when the last Non-Train data set was collected. We're asking people to look at and play with this data to see if you can identify tests we can do in the software to reliably distinguish between train and non-train data.
The above data can be accessed either by downloading this Excel file or by accessing this public Google Sheet. (Please copy the data to another Google Sheet prior to manipulating the data so others can get clean copies of the data.) FYI: We've generally found best detection accuracy occurs when multiple train-positive events occur in a data set- such as growing rectangle width AND changing x measurement, for example; although clearly that particular test will not positively identify a train in the above data. The key is to find those unique ways of looking at the data and its patterns to filter out the noise but recognize a train. THANK YOU for helping with this! If you have observations or suggestions please either leave a comment below or send email to [email protected]. Jim It has been a while……a long while……since I’ve done an update on TrainAlert. This is not due to lack of activity. In fact, my lack of updating here is because of the effort that has been going into TrainAlert. (For the unitiated: TrainAlert is a solution, currently under development, to identify when a train is approaching the town where I live so subscribers can “get on the right side of the tracks” before the inevitable traffic disruption occurs.) The primary challenges in getting this solution built have been 1/ finding a robust technology set upon which to base the solution and 2/ unlearning my 30 year old programming knowledge and applying modern software techniques. The first challenge was addressed thanks to a friend who is interested in Computer Vision technologies. He pointed me to OpenCV, an open source library of image analysis software routines. The second challenge was addressed with time, Google and helpful people on the internet. This blog post is not about the upcoming release of the solution per se. Instead it’s about the stunning capabilities available in OpenCV. OpenCV is yet another fantastic example of what the open source model can deliver. So if you’re interested in kind-of-geeky Computer Vision topics……read on. OpenCV can perform a broad set of tasks on digital images. The images can be still pictures (i.e. photos) or frames from a video camera. The train detection portion of TrainAlert is built using OpenCV routines, tied together by custom code written in Python to handle a variety of logic and analytic tasks. There are three primary OpenCV capabilities that are used to detect passing trains. Background Subtraction The first step in identifying a passing train is finding items that might be a train. Background Subtraction is the OpenCV process/method of identifying new objects in an image…..objects that aren’t normally there. OpenCV’s background subtraction capability watches video frames over time (it keeps a history of the previous 5 video frames) and then identifies items in the current frame that are new. It can’t identify what those items are. They could be a variety of things. But it can at least identify that something new is now in the frame. When something new is found in a frame OpenCV then “subtracts out” the background portions of the image. What is left is an image that contains only foreground objects (i.e. those items that are new). Contour Identification Once it is known new objects are in the frame, they must be identified and characterized in some way. OpenCV can provide size and location information about objects in images. OpenCV calls these descriptors “contours”. For example, OpenCV can draw a rectangle around each contour found in an image, and give back the details of those rectangles; most notably the coordinates of the rectangle’s four corners. (OpenCV will return a list of rectangle coordinates for every contour in an image.) In the case of finding a train, a way to prioritize which contour might be most interesting is by its size. Obviously, trains are pretty large objects. So after knowing there are new objects in the frame, along with the sizes and locations of the foreground items, the TrainAlert program picks the largest frame contour and considers this the most likely "train suspect". However the found contour is still just a suspect. This new “large object” could be grass blowing in the wind. Or vehicles that are visible in the distance. Or clouds that are making dramatic movements. Additional analysis needs to be done to determine if there really is a train in the frame or whether this large contour is some non-train anomaly. Object Tracking One way to discern a train vs non-train contour is to see if and how it moves. A train traveling down a track moves in a pretty predictable fashion. The “big object” needs to be tracked to see if it is moving and, if so, by how much. This is where OpenCV's Object Tracking capability is useful. In order to track an object the TrainAlert program gives the OpenCV Object Tracker the coordinates of the large object that needs to be tracked. OpenCV looks at the color profile found in that contour, and then looks for that same color profile in subsequent video frames coming off the camera. When OpenCV sees that object, it delivers back to TrainAlert the coordinates for where that object is in that most-recently read video frame. When this process is completed for a sampling of video frames, a location history will have been collected for where in the frame that object is over multiple video frames. At this point OpenCV has done all that it can do. Now it's time for TrainAlert to decide "Is this a train or isn't it a train?" In a simple and ideal world one looks at total distance traveled in the frame, compares the starting and ending positions, and concludes the train's direction of travel. Unfortunately, the world is neither simple nor ideal. It's not very easy to decide if there actually is a train or not. The train is not always identified in the same portion of the frame. And some non-train objects don't move like a train moves. Wind blowing tree branches might result in movement data, but the data will likely be lots of "back-and-forth" and will not have consistent progression in the same direction over time. Car lights in the distance definitely move in a consistent direction, but their movement is not as dramatic as train movement because they are farther away in the frame. There are other non-train scenarios as well. Here are two examples of object tracking. The first shows how OpenCV tracked a real train. The second video shows how OpenCV found "something new" in the frame, tracked it, but it turned to not be a train. The trick in building this solution has been figuring out an algorithm that will look at the collected horizontal position values and decide whether the object in question is behaving as a train would. Unfortunately it's not quite as simple as seeing if every data point shows progression in the same direction. The precision of Object Tracking is not perfect. Even with actual trains Object Tracking will sometimes report either no movement or "backward" movement for one or two frames. The tracked "bush" in the second video is easy to disregard, as total horizontal movement is in a very narrow window. But other items that aren't trains don't behave in this way.
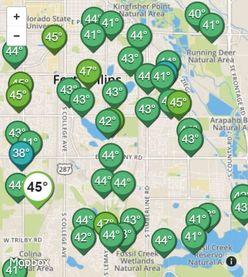
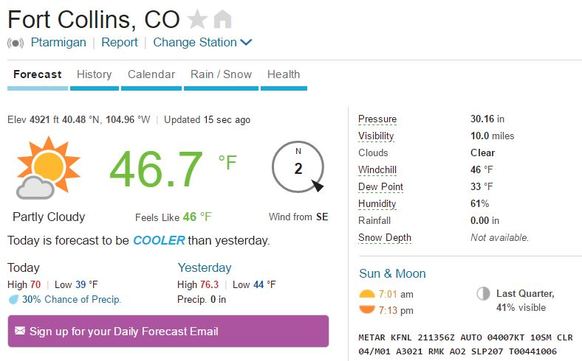
I’ll spare the reader the gory details, but the bottom line is a variety of train and non-train object tracking data was put into a spreadsheet and patterns were identified. Those patterns were identifiable with some simple calculations and, as a result, a method for determining train vs non-train scenarios has been developed. Although these methods, too, are not perfect, current testing is showing an accuracy rate of greater than 90% for correctly identifying passing trains. The train detection portion of TrainAlert is in final testing mode. Without the OpenCV technology (and the help of others) I don’t believe this portion of the solution would be in the state it is today. OpenCV is an astonishing technology that makes me very enthused about the types of solutions that are possible in the future. It will be exciting to see what sort of Computer Vision applications become available. So what is next for TrainAlert? This article has been only about the train detection portion. But there also needs to be a “subscriber notification” portion of TrainAlert – the infrastructure to deliver alerts to users. Another generous friend is helping me on that front. As that gets solidified more will be written here to describe how that works. For now we’re marching ahead to finalize the first release – and help the citizens of Northern CO deal with the disruptive train traffic that plagues the area. Jim "See you’ve been in the sun and I’ve been in the rain” – So Far Away, Dire Straits Cycling in the wind stinks. Tailwinds can trick you into thinking you're really fit. Headwinds are a thief of effort. As a result, I like knowing how much wind I'll encounter for a cycling trail I frequent before driving the 10+ miles to get to the trailhead. It’s no fun to load everything into the car and drive there only to discover the conditions aren't great. Weather Underground delivers “hyper-local” weather information and forecasts that enable me to determine conditions before leaving home. They do this by gathering data from a large network of weather stations. This is a great example of the "Internet Of Things" - a term I find amazingly boring given the excitement of the solutions. The Weather Underground website and smartphone app deliver content to users based on data collected from three sources:
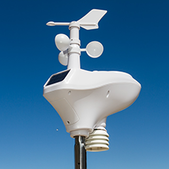
How did the company establish this huge network of Personal Weather Stations? They recognized an opportunity to leverage the proliferation of low-cost weather stations and their ability to connect to the Internet. Weather Underground also made it easy for weather station owners to register and connect their units with the Weather Underground service. Now all data from someone's Personal Weather Station is available to anyone accessing Weather Underground. This data is also used to provide forecasts for very precise locations. (e.g. What is the weather forecast for my neighborhood?) Creating a Personal Weather Station is easy. Weather Underground even provides a Buying Guide that identifies a variety of compatible options. Many stations not listed in their Buying Guide will work as well. A quick search on Amazon.com provides a host of very reasonably priced Personal Weather Stations that will connect to Weather Underground. It’s clear that weather station companies see “Weather Underground Compatible” as an important selling feature as it is frequently listed as a product capability. Weather Underground users can monitor a specific station very easily because all registered stations are placed on a map. That is what I do before leaving on a bike ride. You can simply click on any station you wish to monitor. Comments
The discipline of Product Management is fascinating. Great Product Managers are both analytic and creative. Analytic skills are required to understand and prioritize customer requirements, perform competitive analyses, and understand R&D budget constraints. Creativity is needed to determine cost-effective features that address the user's requirements. A recent experience with a Bosch appliance caused me to label one of their features as one of the most creative I’ve ever seen in any product.
My wife and I are in the middle of a kitchen remodel. Bosch dishwashers, as you may already know, are known for being exceptionally quiet. In fact, they are so quiet, Bosch received “complaints” that users couldn't tell whether the dishwasher was running or not. It is an odd conundrum: Users want a quiet dishwasher, but they also want to know the dishwasher’s status. Bosch’s answer? The Product Management and Engineering teams enabled their dishwasher to project onto the floor (via light) the dishwasher’s status, including the time left in the cycle. Such a brilliant idea! It doesn’t change the outward look of the unit at all, yet it conveys the unit is running and when it will be done. Is there some sort of Product Management “Gold Star” award for incredibly unique and elegant solutions to customer problems? I doubt it. But if there was, and I had a vote, Bosch would win it hands down! What product feature would you award a “Gold Star”? I’d love to hear what has impressed you in the products you use. Jim A few weeks ago we were at friends’ for dinner. On the back patio I noticed a weather station. I started asking my friend about it. (This happens to be one of the key folks who was instrumental in sparking my interest in technology early in my career. He gave me the opportunity to experience a wide variety of computing technologies. So we frequently talk technology together.) The conversation went down a pretty predictable path. I asked him about this or that capability of his weather station. He not only answered the questions but offered up other things he thought I’d find of interest. As the conversation was wrapping up I said “I know this might be a long shot, but is your station registered with Weather Underground?” He got a big grin and said “YUP!”.
I’ve used Weather Underground (WU) for a number of years. They have great methods for packing a ton of information into a single display. WU’s model for delivering hyperlocal weather relies on individuals with their own weather stations who are willing to register their station with WU. Data from those weather stations is then automatically uploaded to WU. Although I became aware of WU’s data gathering model a year or two ago, it was fascinating to actually see a station providing data to the service. It was profound to actually see one of these stations that I've been relying on as a WU user. WU reports they have over 250,000 weather stations providing data to their service. What a great Internet of Things example: Take advantage of a device’s ability to gather data, and then contribute that data to create a more robust aggregated set of data for reporting, analytics, etc. But my interest in WU goes beyond the Internet of Things. Another area of interest in my consulting work is business ecosystems. More specifically, business ecosystems that are structured to create the “upward spiral” (as opposed to a downward spiral). The upward spiral is a virtuous cycle that creates more and more success for all parties as the system succeeds together. Smartphones and apps are a good example: The more apps that are available in Apple's App Store or Google Play the more attractive (and successful) those phone platforms become. And the more successful those phone platforms become, the more app developers think of additional apps to develop and contribute to iTunes and Google Play. The success in each area feeds the other area. WU’s approach for gathering hyperlocal weather data was very wise: Leverage the power of the people who are already interested in weather. These hobbyists enjoy weather to the point they’re willing to spend their own money on a weather station. And by enabling the hobbyist to connect their station to WU they actually enhance the hobbyist’s experience. Those hobbyists are now contributing to a greater good: Helping people understand the weather around them. WU gets hyperlocal weather data for the “cost” of creating methods for personal weather stations to report their collected data. It’s brilliant! Because WU touches on multiple areas of my consulting work, I’ll be doing a multi-post blog series on the WU service. The business and business ecosystem will be reviewed, as well as the weather station / data collection aspects of their service. WU brings the two together to deliver a fantastic weather service. Are you a WU user? If so, why do you like it? Have you tried it and abandoned it? If so, why? Jim We're all familiar with terms that become exceedingly popular very quickly and, in some instances, overused. Big Data. 3D printing. Cloud Computing. There are other examples - both in high tech and not. We hear the terms. We think we understand them. But do we really?
When a technology or concept becomes as popular and hyped as much as cloud computing is today there is a distinct danger that people will lose sight of why the technology is important and the real value it provides. And unfortunately, focusing on just the term and not on why it is important comes at the expense of the most important thing: Paying attention to what the customer truly needs. In other words - what customer problems need to be solved? As I've worked with businesses interested in or actually moving to the cloud I've been amazed at how frequently, when I ask what their solution needs to be able to do, I receive a response along the lines "It needs to be in the cloud." OK - but WHY? A number of years ago I learned a valuable Product Management principle that I use to this day: A "customer requirement" is only a requirement if it can be solved via multiple, distinct methods or solutions. Customers care about having their problems solved. They oftentimes don't care how they're solved. In the vast majority of cases customer requirements need to be written such that Engineering could potentially solve them in a variety of ways. This encourages creativity and, hopefully, coming up with solutions that no one may have considered. "The solution needs to run in the cloud." is not a customer requirement. Data security. Easy WW access. High availability. Low cost. All of these are examples of requirements - problems the final solution needs to address. It's possible that one way to solve these requirements is via a solution that is running in the cloud. But there may be other viable non-cloud solutions as well. Don't confuse the selection of a particular solution implementation with the requirement itself. When the requirement is quenching thirst possible solutions are water, milk, tea or some other beverage. [The following comments and interpretation of the solution below are mine alone. I do not have a relationship with Pelco and was not involved in the creation of the solution. I'm inferring requirements and business drivers from Pelco's marketing materials. I think the MultiSight solution is a good example to highlight this requirements vs technology discussion.] Pelco is a leading manufacturer of cameras used in video monitoring. Their traditional solution involves capturing video streams and storing the data on local servers/storage for later review. This solution has tended to focus on local site storage and access. As companies with multi-site operations become more prominent and various types of expertise is centralized (such as a centralized Security department or centralized Operations department) there is a growing need for a central location (i.e. headquarters) to be able to access video streams captured at remote locations. Some requirements that would be easy to surmise:
Pelco created MultiSight, a software solution that enables remote sites to have their captured video available to users at other sites. MultiSight is implemented on Amazon Web Services. It turns out (as one might guess) that Amazon's cloud is a very cost effective and convenient method for solving the requirements as they are written above. But also note that nowhere in the requirements list is the word "cloud" used. Pelco could have solved those requirements with a number of other solution architectures. It is apparent, though, that the cloud model and technology was the best implementation alternative. Lest they be forgotten the kinds of customer requirements that a cloud-based solution can address include:
These are the kinds of requirements businesses should look for when considering cloud technologies as the basis of a solution. So while cloud computing is incredibly exciting and is changing the face of how computing is delivered, don't lose sight of what the real customer requirements are. Challenge yourself to be sure you understand and document the requirements that address the real customer needs - and not get caught up in buzzword hype that delivers a false sense of security of having a modern solution that is keeping up with the times. A modern, high-tech solution that doesn't actually solve a problem is of no use. Jim |
Jim's BlogThoughts about Solar Energy, Electric Cars, Train Alert and more. Archives
February 2022
Categories
All
|







 RSS Feed